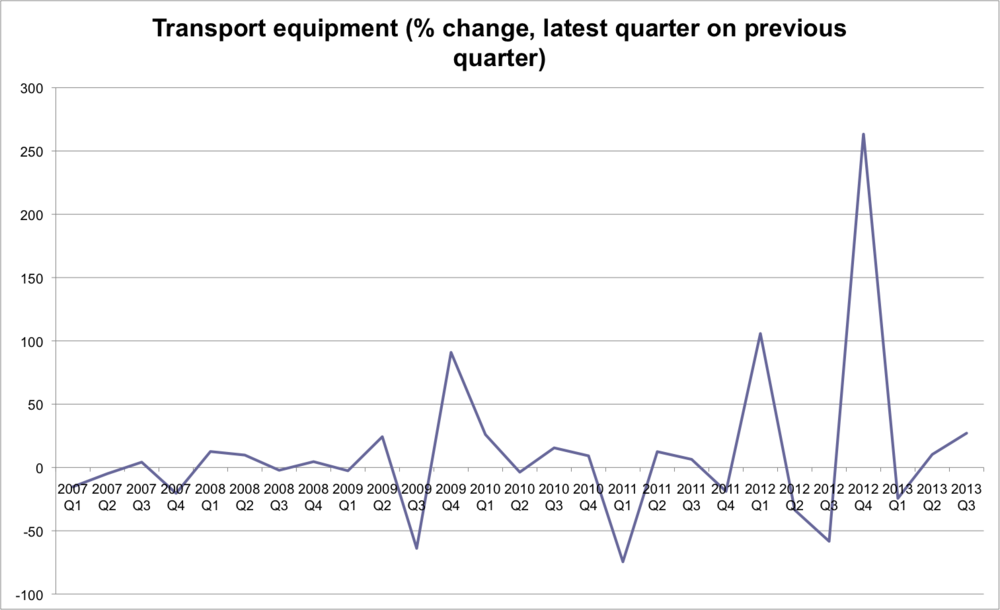
The chart below shows investment in "Transport equipment" from 2007 to Q3 2013. It is a lot more volatile than it has been previously, with an especially large increase in Q4 2012.

Here's the raw numbers, showing that the spike in growth rate is the result of being at a low base. This is because of a large decline from Q4 2010 to Q1 2011.

Does anyone know the detail as to what was driving this?