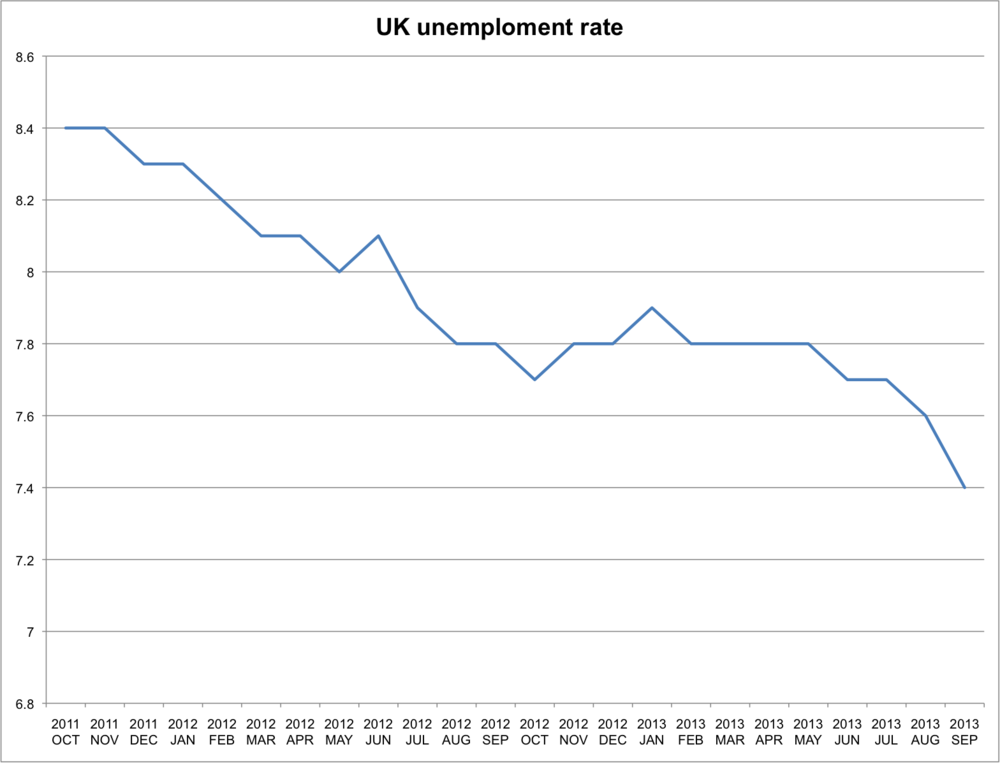
There's lots of talk that UK unemployment is falling faster than expected, and the Bank of England have brought forward their forecast that it will first fall below 7% from 2016 to 2014. As the chart below shows the rate has steadily fallen since late 2011.

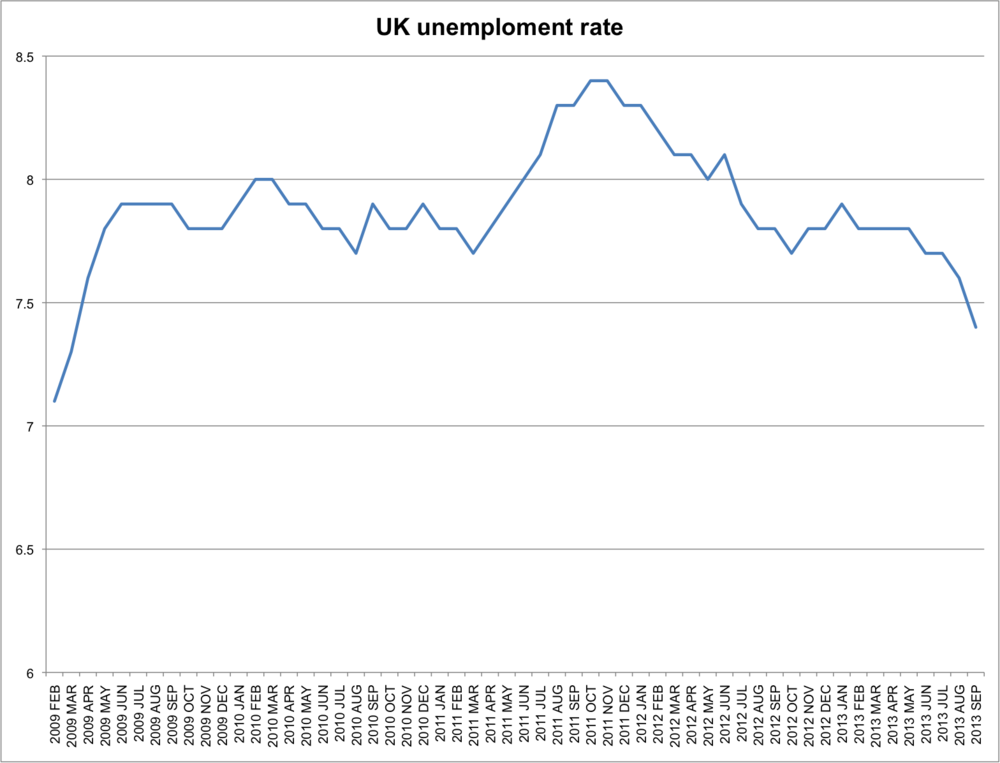
But this is also a nice exercise in the importance of time frame. Here's the same data from February 2009 (i.e. the month in which it went above 7% for the first time)

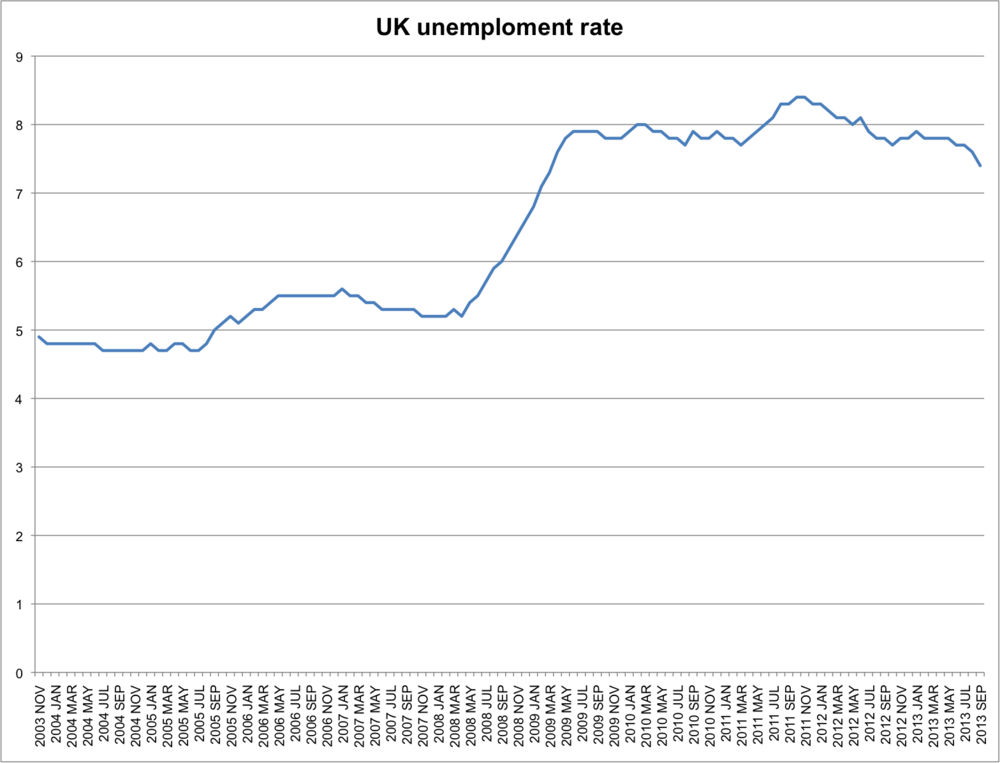
And here it is going back the last decade

I'm using UK unemployment rate aged 16+ (series code MGSX)