One of the big warning lights in the pre 2008 boom was when broad money breached a 10% year-on-year growth rate. Since then, however the Bank of England have switched its preferred measure of M4 to M4ex. Can we use the same rules of thumb when the measure changes? I'm not sure. The chart below shows M4ex recently. One of the reasons I've not been too concerned about UK monetary aggregates is that M4ex is pretty stable, growing between 3%-5% since May 2012.

Indeed if we add the 3 month annualised growth rate (hashed line) it's risen from -0.4% in Feb 2014 to 8.4% just 2 months later (its highest rate in the series).
This morning saw the release of Eurozone M3 data, which you can see below:
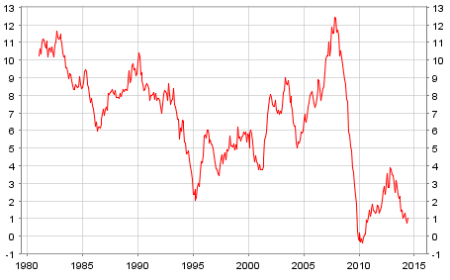 After the dramatic slowdown (note: not a contraction) that bottomed out in 2010, it's not just that the rising growth rates haven't been sustained, but have continued to fall. Looking at M3 for the UK we see the following:

The 12 month growth rate was between 2% and 4.3% from Dec 2012 through Nov 2013, but has since dropped dramatically. Despite a blip in Feb 2014 it's now actually contracting.
As recently mentioned, price inflation is also slowing. PPI is weak and CPI is way below target. Food for thought.