Some Market Monetarists have been critical of the Bank of England for being so slow to cut interest rates through 2008. I wanted to look at the GDP figures that we had at the time, to see whether recent revisions are helping our hindsight. One of the difficulties with this is that the ONS only have GDP releases going back to 2009. I was able to track down the releases, and here's what we find:

This is for the quarterly growth rate of NGDP compared to the previous year (IHYO). The green columns are what we know as of May 2014 (based on the second estimate of Q1 2014). The blue column is the second estimate of 2008 Q2, released in August 2008. The red column is the second estimate of 2008 Q3, released in November 2008. So, the post Lehman collapse in NGDP is a lot more evident now, than it was at the time.
Ideally we would be looking at the preliminary estimate, but they don't seem to be available on the ONS website. an alternative (and I appreciate the suggestion from someone at the ONS) is to look at the GDP revisions triangles. If you're not analytically minded, like me, these can look quite intimidating. What I've done is focus on GDP q-on-q growth rates of real GDP (i.e. GDP at market prices, chained volume measure).
The striking thing is the major revisions that were published in the final estimates of 2011 Q2 (released in September 2011). These were then somewhat offeset by corrections for the 2008 figures in the final estimate of 2012 Q1 (released in June 2012), and for the 2009 figures in the final estimate of 2013 Q1 (released in June 2013).
The bottom line is that early estimates of the economy in 2008 understated the problem:

Whilst early estimates of the economy in 2009 overstated the problem:
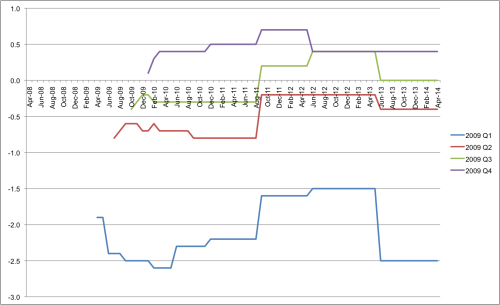
What really jumps out though, is the scale of the revisions to 2008 Q3 real GDP.