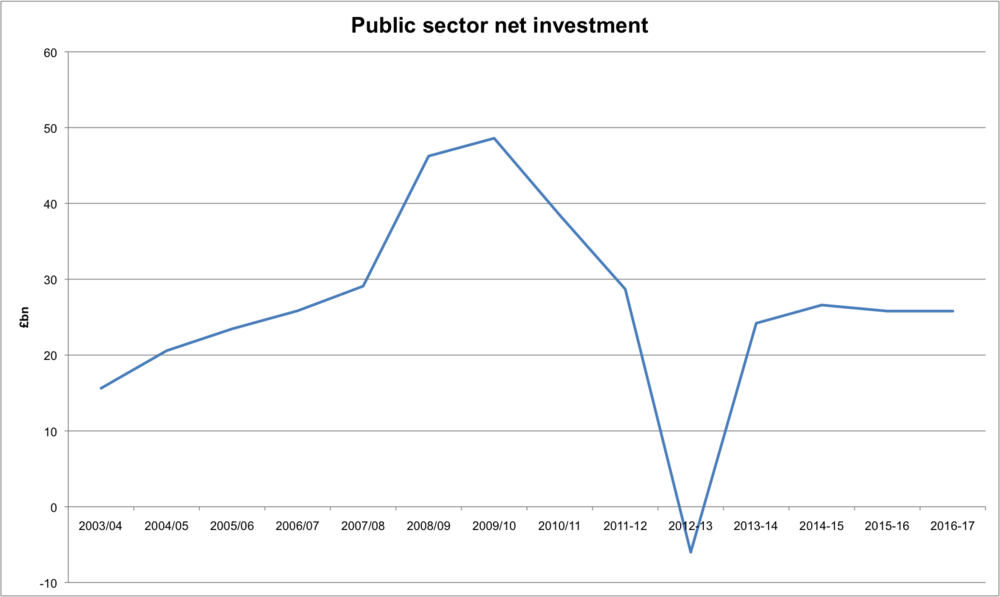
In a previous post on government spending I looked at public sector net investment from 2003/04 until 2011/12. Here's an updated version using the Budget 2013 forecasts through 2016/17.
 The decline in 2012/13 is immediately apparent, but it's important to see that by 2014/15 spending is forecast to return to it's 2007 level. The debate is really about the the severity of the contraction since the 2010 general election, the extent to which that was an inevitable consequence of a 2009 fiscal stimulus, and the one off factors (such as transfer of Royal Mail assets) that distort the figures. What strikes me though is that I don't know any economists that would advise the government to do the above.
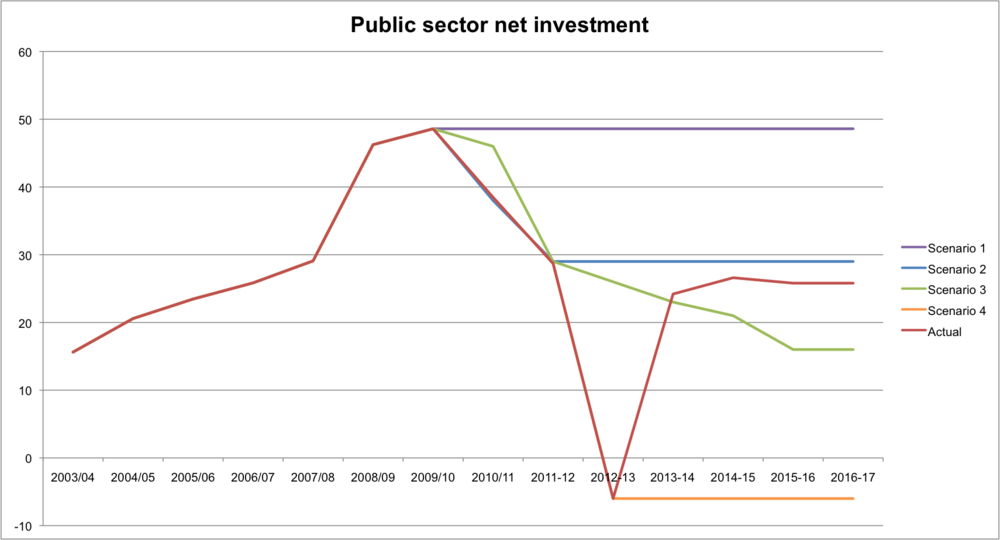
The chart below includes 4 scenarios:
- The purple line (scenario 1) is the arch Keynesian "keep on spending until the economy recovers and to hell with the debt!" It's what I suspect many Keynesians believe, albeit are very reluctant to admit to.
- The blue line (scenario 2) treats the 2009 stimulus as a temporary injection, and maintains investment at its pre stimulus levels
- The green line (scenario 3) acknowledges that the 2008 - 2011 spike put public debt on a new course, and therefore mirrors the rise in order to steadily return to 2004 levels
- The orange line (scenario 4) is an ultra austerian desire to shrink the state, allow depreciation to eat up the existing capital stock, and flat line with negative net investment
- The red line (actual) is taken from the March 2013 Budget.
I'd be really interested to know various preference orderings. My intuition is that scenario 3 would be preferred to the actual by both sides of the debate. Indeed one would think that the serious debate would be between scenarios 2 and 3.

Source: 2003/04 - 2010/11 from PSF1 of the Public Sector Finances.