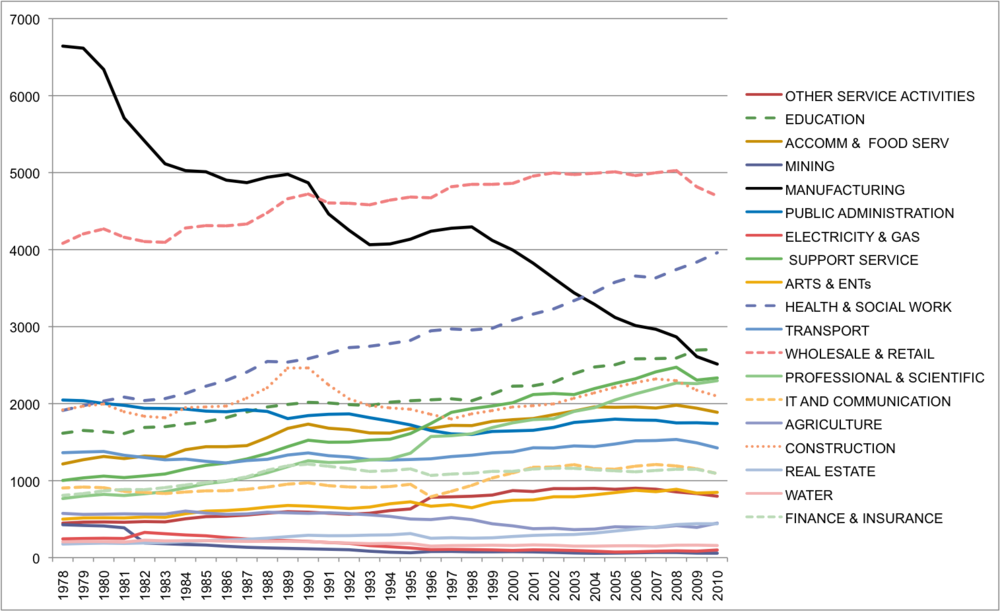
I've just received by email the following chart from Ewen Stewart, of Investec (source). It shows long terms changes in UK employment by sector.
 As he points out, some of the striking features include:
- The decline in Manufacturing
- The cyclicality of Retail, Construction, and IT & Comms
- The structural increases in Health and Social Work, and Education
It certainly ties into the view that the UK economy has been shifting from a manufacturing to a strong dependency on public services. Finance and Insurance is minor compared to state funded industries.
The April 2012 Labour Market Statistics also provide some interesting insights. Table EMP13 shows employment by industry sector, and I wanted to see what's been going on during the "recovery". Unfortunately they only provide 3 years worth of data, so it doesn't help us compare the boom and the bust. This would be useful though, because Paul Krugman has argued that US employment fell in a balanced way across all sectors (I can't find the presentation online but it was very simlar to this(.pdf)). This would suggest that the recession is due to an aggregate demand shock.
For the UK, however, there are clear structural differences. Some industries are contracting, others are gorwing (and indeed quite strongly).

To see this in more detail I focused on the five biggest sectors (those that employ more than 2m people each) and what does it show? Massive falls in Construction, but clear differences between the different sectors.

I also wondered about Public vs. Private sector employment. Table EMP04 provides a breakdown, and I've just taken the absolute numbers (note that private sector employment is on the RHS, it is around 80% of total employment whilst public sector is around 20%).
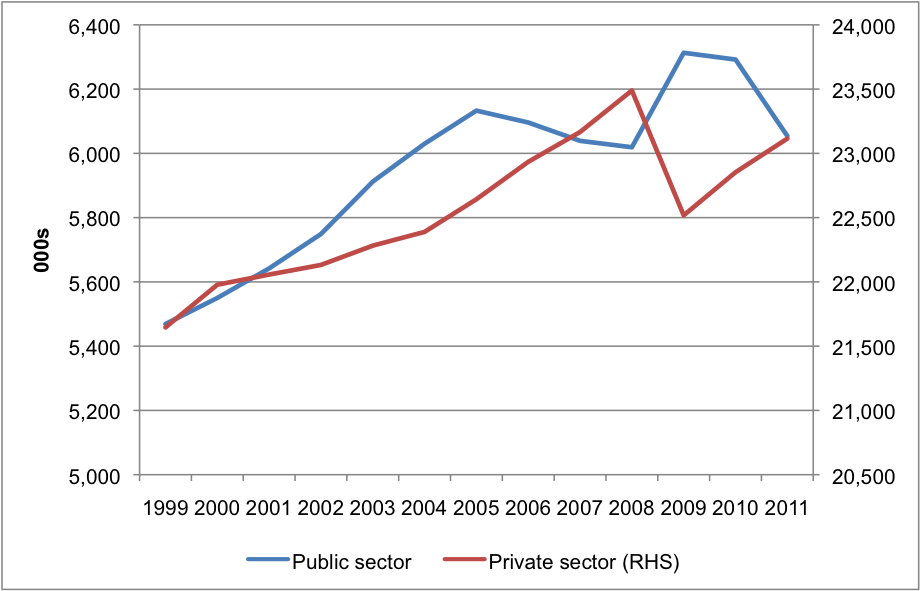 It is likely that these numbers underestimate the scale of the public sector, because if a local council outsources cleaning to a private contractor, for example, this will be treated the same as people switching from public to private provision of goods. We see a large increase in public sector employment from 1999 - 2005, and this isn't simply because it's growing from a lower base. During this period public sector rises from 20.2% of total employment to 21.3%. But the ratio then inverts with (relatively) high private sector growth just prior to the financial crisis.
The fiscal stimulus of 2008 led to a spike in private sector jobs, but most of those have now been reduced. This is exactly what a "stimulus" is supposed to do in theory - provide a temporary boost. But it seems odd that people complain about falling public sector employment, now that we're 4 years after the stimulus. It's impossible to continue that temporary growth permanently. In reality what we see is the failure of that policy. At the very least, the unwinding should be treated as part of the costs.